Report Summary
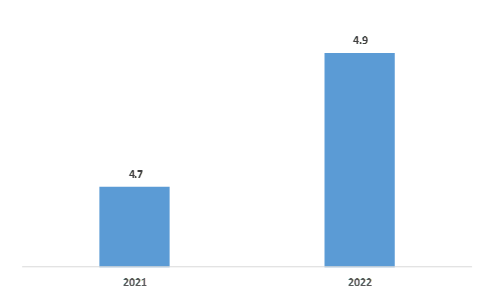
Artificial turf is widely used in sports, landscaping, and commercial spaces owing to its durability, low maintenance, and water conservation benefits. Artificial turf solutions are evolving rapidly with innovative materials, improved durability, and realistic aesthetics. The global artificial turf market is undergoing robust growth as industries, municipalities, and homeowners are increasingly adopting synthetic turf for sustainable and low-maintenance alternatives to natural grass. According to Eternity Insights, artificial turf market is anticipated to grow at 8.4% by 2034, from USD 4.7 billion in 2021 to USD 4.9 billion in 2022.
The global artificial turf market is driven by several factors, including booming sports infrastructure development, increasing water conservation initiatives, and growing urbanization and landscaping trends. Moreover, the development of sustainable & recyclable turf systems and smart turf technology & advanced monitoring are anticipated to provide significant growth opportunities for the artificial turf market.
Booming Sports Infrastructure Development Drives Artificial Turf Market
The rapid growth in global sports infrastructure is one of the key market growth drivers for the artificial turf market. Governments, educational institutions, and private organizations are heavily investing in the construction and renovation of stadiums, training grounds, and multipurpose sports complexes to meet the rising demand for high-performance playing surfaces. According to the Sports Business Journal, approximately USD 5.8 billion was invested in the construction and renovation of professional and college sports facilities across the U.S. and Canada in 2024. This was reported to be about 18% increase from the USD 4.9 billion spent on projects that were completed last year. This surge in infrastructure spending is driving the installation of artificial turf as a cost-effective, durable alternative to natural grass that can withstand heavy foot traffic and varying weather conditions.
Artificial turf systems offer consistent performance, better player safety, and reduced maintenance costs, making them ideal for high-frequency events and multiple sports activities on a single field. In recent years, government bodies have awarded several contracts pertaining to artificial turf solutions. For instance, in May 2025, the London Borough of Hackney awarded a contract to S&C Slatter Ltd. for the refurbishment of the artificial turf pitch at Haggerston Park, amounting to about USD 660,000. Likewise, in January 2025, the Ayuntamiento de Langreo (Langreo City Council) in Spain awarded a public works contract worth USD 265,000 for the supply and installation of next-generation artificial turf on two municipal football fields in Tuilla and Lada. Thus, growing investment in sports infrastructure development is driving the artificial turf market.
Sustainable & Recyclable Turf Systems Offer Lucrative Market Growth Opportunities
Growing awareness about environmental impact is one of the leading market growth opportunities for artificial turf companies that are investing in sustainable and recyclable products. Stringent regulations around microplastics, PFAS chemicals, and waste disposal are driving consumers for sustainable & recyclable turf systems. Several manufacturers are expanding their product portfolio with fully recyclable polyethylene yarns or hybrid bio-based materials.
In addition, several manufacturers are exploring innovative materials made from renewable sources like sugarcane, coconut husks, and other such natural sources to cut down on carbon footprints. In March 2025, Notts Sport launched CocoTurf, a non-plastic artificial turf made entirely from natural coconut fibres. The demand for sustainable and recyclable turf systems is anticipated to grow, thereby further leading to significant opportunities for artificial turf market.
Polyethylene is the Largest Raw Material Segment Owing to its Realistic Look and Versatility
Polyethylene (PE) is the most widely used raw material in the artificial turf market, owing to its softness, durability, and realistic appearance similar to grass. Compared to other synthetic fibers, PE offers excellent UV resistance, which helps maintain color vibrancy and structural integrity even under harsh sunlight and heavy foot traffic.
The material’s cost-effectiveness and easy recyclability are further strengthening its position in artificial turf market with growing sustainability requirements. In February 2025, TenCate launched Pivot, a turf requiring no performance infill and is made from recyclable PE fibers. Thus, PE-based turf continues to account for the largest share of raw materials for artificial turf globally.
Organic Infill is the Fastest Growing Segment for its Eco-Friendly Benefits
Organic infill is anticipated to be the fastest growing segment within the infill materials category owing to environmental regulations around petroleum-based and micro plastics materials. Organic infill are made from natural materials such as cork, coconut husk, and walnut shells and are gaining popularity for their sustainability, low chemical content, and improved player safety. Organic infills offer better water permeability and biodegradability, addressing some of the key environmental and health concerns associated with synthetic infills.
In addition, regulatory shift is also promoting organic infill adoption. In September 2023, the European Commission introduced a ban on microplastic-based infills by 2031, further accelerating the shift toward organic and eco-friendly alternatives. Thus, sports facilities, schools, and municipalities are increasingly adopting organic infill systems to meet both performance standards and regulatory shift.
Residential Segment Experiences Rapid Growth with Expanding Creative Applications
The residential segment is emerging as one of the fastest-growing end-user segments for artificial turf, driven by increasing preference for vibrant and low-maintenance green spaces by homeowners. The companies are continuously expanding their product portfolio to meet the growing demand from residential end users. For instance, in October 2023, Condor Grass launched artificial turf with Colorshift technology that reacts to outdoor temperatures and changes colors with the seasons. This product was targeted to meet the growing residential demand. Furthermore, in December 2023, Condor Group acquired Betap, a leading player in the textile floor. This strategic acquisition aims to deepen Condor’s understanding of customer preferences and evolving market dynamics, enabling the company to deliver more tailored, high-quality solutions.
Furthermore, favorable government initiatives are also further driving the demand for artificial turfs in residential applications. In areas prone to frequent droughts and strict water restrictions, such as California, local water districts and city governments have also promoted or subsidized artificial turf installation for residential lawns to conserve water. As awareness spreads about the long-term savings on water bills and landscaping services, the residential segment is expected to witness rapid growth.
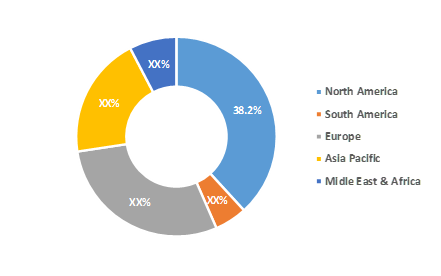
Asia-Pacific is the Fastest Growing Region Owing to Rapid Infrastructure Investments and Supportive Government Initiatives
Asia-Pacific is emerging as the fastest-growing region in the artificial turf market, driven by expanding urbanization, a booming middle class, and rising investments in sports and recreational infrastructure. Countries like India, China, Japan, South Korea, and other Southeast Asian nations are actively investing in modern sports facilities, community grounds, and public parks to promote healthier lifestyles and boost participation in organized sports. For instance, India’s Ministry of Youth Affairs and Sports received an allocation of approximately USD 460 million for 2025–26, a substantial 130.9% increase from the USD 200 million allocated in 2014–15. This sustained, government-led push reflects the strategic focus on developing sports facilities and training centers nationwide.
In July 2025, the Australian federal government confirmed a USD 2.25 billion contribution toward the construction and upgrade of 17 venues for the 2032 Brisbane Olympics and Paralympics. As similar initiatives gain momentum across the Asia-Pacific region, demand for advanced artificial turf systems is expected to rise sharply, creating lucrative opportunities for market players over the forecast period.
Competitive Landscape
The artificial turf market is moderately consolidated, with established global players and innovative regional manufacturers competing for market share through product differentiation and strategic expansion. Leading companies such as TenCate Grass, FieldTurf (a Tarkett company), Shaw Sports Turf, CCGrass, and Sport Group consistently focus on research and development to introduce advanced, eco-friendly turf systems that address evolving regulatory standards and sustainability demands.
Moreover, companies are increasingly opting for mergers, acquisitions, and strategic partnerships as players look to strengthen their distribution networks and expand their geographic presence. Some of the key developments include:
- In June 2025, TenCate Grass acquired a majority stake in the LandTek Group further expanding their presence in the U.S.
- In December 2024, AstroTurf Corporation, a subsidiary of Sport Group, acquired Coast to Coast Turf, further expanding their presence in the U.S.
- In November 2022, Beaulieu International Group acquired a leading US synthetic turf manufacturer Act Global, strengthening its position in the sports turf.
Table Of Contents
Table of Contents
Global Artificial Turf Market Report 2020, Forecast to 2027
1 Scope of the Study
1.1 Artificial Turf Introduction
1.2 Research Programs
1.3 Analysis of Macroeconomic Indicators
1.4 Years Considered
1.5 Methodology
1.6 Data Source
1.7 Research Objectives
2 Artificial Turf Industry Overview
2.1 Global Artificial Turf Market Size (Million USD) Comparison by Regions (2020-2027)
2.1.1 Artificial Turf Global Import Market Analysis
2.1.2 Artificial Turf Global Export Market Analysis
2.1.3 Artificial Turf Global Main Region Market Analysis
2.2 Market Analysis by Type
2.2.1 PP Sports Turf
2.2.2 PE Sports Turf
2.2.3 Nylon Sports Turf
2.2.4 Others
2.3.2 Hockey Stadium
2.3.3 Tennis & Paddle Stadium
2.3.4 Multisports Stadium
2.3.5 Rugby Stadium
2.3.6 Others
2.4.2 Global Artificial Turf Revenue and Market Share by Manufacturer (2018-2020)
2.4.3 Global Artificial Turf Industry Concentration Ratio (CR5 and HHI)
2.4.4 Top 5 Artificial Turf Manufacturer Market Share
2.4.5 Top 10 Artificial Turf Manufacturer Market Share
2.4.6 Date of Key Manufacturers Enter into Artificial Turf Market
2.4.7 Key Manufacturers Artificial Turf Product Offered
2.4.8 Mergers & Acquisitions Planning
2.5 Artificial Turf Historical Development Overview
2.6 Market Dynamics
2.6.1 Market Opportunities
2.6.2 Market Risk
2.6.3 Market Driving Force
2.6.4 Porter's Five Forces Analysis
3 Upstream and Downstream Market Analysis
3.1 Upstream Analysis
3.1.1 Macro Analysis of Upstream Markets
3.1.2 Key Players in Upstream Markets
3.1.3 Upstream Market Trend Analysis
3.1.4 Artificial Turf Manufacturing Cost Analysis
3.2 Downstream Market Analysis
3.2.1 Macro Analysis of Down Markets
3.2.2 Key Players in Down Markets
3.2.3 Downstream Market Trend Analysis
3.2.4 Sales Channel, Distributors, Traders and Dealers
4 Global Artificial Turf Market Size Categorized by Regions
4.1 Global Artificial Turf Revenue, Sales and Market Share by Regions
4.1.1 Global Artificial Turf Sales and Market Share by Regions (2015-2020)
4.1.2 Global Artificial Turf Revenue and Market Share by Regions (2015-2020)
4.2 Europe Artificial Turf Sales and Growth Rate (2015-2020)
4.3 APAC Artificial Turf Sales and Growth Rate (2015-2020)
4.4 North America Artificial Turf Sales and Growth Rate (2015-2020)
4.5 South America Artificial Turf Sales and Growth Rate (2015-2020)
4.6 Middle East & Africa Artificial Turf Sales and Growth Rate (2015-2020)
5 Europe Artificial Turf Market Size Categorized by Countries
5.1 Europe Artificial Turf Sales, Revenue and Market Share by Countries
5.1.1 Europe Artificial Turf Sales by Countries (2015-2020)
5.1.2 Europe Artificial Turf Revenue by Countries (2015-2020)
5.1.3 Germany Artificial Turf Sales and Growth Rate (2015-2020)
5.1.4 UK Artificial Turf Sales and Growth Rate (2015-2020)
5.1.5 France Artificial Turf Sales and Growth Rate (2015-2020)
5.1.6 Russia Artificial Turf Sales and Growth Rate (2015-2020)
5.1.7 Italy Artificial Turf Sales and Growth Rate (2015-2020)
5.1.8 Spain Artificial Turf Sales and Growth Rate (2015-2020)
5.2 Europe Artificial Turf Revenue (Value) by Manufacturers (2018-2020)
5.3 Europe Artificial Turf Sales, Revenue and Market Share by Type (2015-2020)
5.3.1 Europe Artificial Turf Sales Market Share by Type (2015-2020)
5.3.2 Europe Artificial Turf Revenue and Revenue Share by Type (2015-2020)
5.4 Europe Artificial Turf Sales Market Share by Application (2015-2020)
6 Asia-Pacific Artificial Turf Market Size Categorized by Countries
6.1 Asia-Pacific Artificial Turf Sales, Revenue and Market Share by Countries
6.1.1 Asia-Pacific Artificial Turf Sales by Countries (2015-2020)
6.1.2 Asia-Pacific Artificial Turf Revenue by Countries (2015-2020)
6.1.3 China Artificial Turf Sales and Growth Rate (2015-2020)
6.1.4 Japan Artificial Turf Sales and Growth Rate (2015-2020)
6.1.5 Korea Artificial Turf Sales and Growth Rate (2015-2020)
6.1.6 India Artificial Turf Sales and Growth Rate (2015-2020)
6.1.7 Southeast Asia Artificial Turf Sales and Growth Rate (2015-2020)
6.1.8 Australia Artificial Turf Sales and Growth Rate (2015-2020)
6.2 Asia-Pacific Artificial Turf Sales and Revenue (Value) by Manufacturers (2018-2020)
6.3 Asia-Pacific Artificial Turf Sales, Revenue and Market Share by Type (2015-2020)
6.3.1 Asia-Pacific Artificial Turf Sales Market Share by Type (2015-2020)
6.3.2 Asia-Pacific Artificial Turf Revenue and Revenue Share by Type (2015-2020)
6.4 Asia-Pacific Artificial Turf Sales and Market Share by Application (2015-2020)
7 North America Artificial Turf Market Size Categorized by Countries
7.1 North America Artificial Turf Sales, Revenue and Market Share by Countries
7.1.1 North America Artificial Turf Sales by Countries (2015-2020)
7.1.2 North America Artificial Turf Revenue by Countries (2015-2020)
7.1.3 United States Artificial Turf Sales and Growth Rate (2015-2020)
7.1.4 Canada Artificial Turf Sales and Growth Rate (2015-2020)
7.1.5 Mexico Artificial Turf Sales and Growth Rate (2015-2020)
7.2 North America Artificial Turf Revenue (Value) by Manufacturers (2018-2020)
7.3 North America Artificial Turf Sales, Revenue and Market Share by Type (2015-2020)
7.3.1 North America Artificial Turf Sales Market Share by Type (2015-2020)
7.3.2 North America Artificial Turf Revenue and Revenue Share by Type (2015-2020)
7.4 North America Artificial Turf Sales Market Share by Application (2015-2020)
8 South America Artificial Turf Market Size Categorized by Countries
8.1 South America Artificial Turf Sales, Revenue and Market Share by Countries
8.1.1 South America Artificial Turf Sales by Countries (2015-2020)
8.1.2 South America Artificial Turf Revenue by Countries (2015-2020)
8.1.3 Brazil Artificial Turf Sales and Growth Rate (2015-2020)
8.2 South America Artificial Turf Revenue (Value) by Manufacturers (2018-2020)
8.3 South America Artificial Turf Sales, Revenue and Market Share by Type (2015-2020)
8.3.1 South America Artificial Turf Sales Market Share by Type (2015-2020)
8.3.2 South America Artificial Turf Revenue and Revenue Share by Type (2015-2020)
8.4 South America Artificial Turf Sales Market Share by Application (2015-2020)
9 Middle East and Africa Artificial Turf Market Size Categorized by Countries
9.1 Middle East and Africa Artificial Turf Sales, Revenue and Market Share by Countries
9.1.1 Middle East and Africa Artificial Turf Sales by Countries (2015-2020)
9.1.2 Middle East and Africa Artificial Turf Revenue by Countries (2015-2020)
9.1.3 GCC Countries Artificial Turf Sales and Growth Rate (2015-2020)
9.1.4 Turkey Artificial Turf Sales and Growth Rate (2015-2020)
9.1.5 Egypt Artificial Turf Sales and Growth Rate (2015-2020)
9.1.6 South Africa Artificial Turf Sales and Growth Rate (2015-2020)
9.2 Middle East and Africa Artificial Turf Revenue (Value) by Manufacturers (2018-2020)
9.3 Middle East and Africa Artificial Turf Sales, Revenue and Market Share by Type
9.3.1 Middle East and Africa Artificial Turf Sales Market Share by Type (2015-2020)
9.3.2 Middle East and Africa Artificial Turf Revenue and Revenue Share by Type (2015-2020)
9.4 Middle East and Africa Artificial Turf Sales Market Share by Application (2015-2020)
10 Global Artificial Turf Market Segment by Type
10.1 Global Artificial Turf Revenue, Sales and Market Share by Type (2015-2020)
10.1.1 Global Artificial Turf Sales and Market Share by Type (2015-2020)
10.1.2 Global Artificial Turf Revenue and Market Share by Type (2015-2020)
10.2 PP Sports Turf Sales Growth Rate and Price
10.2.1 Global PP Sports Turf Sales Growth Rate (2015-2020)
10.2.2 Global PP Sports Turf Price (2015-2020)
10.3 PE Sports Turf Sales Growth Rate and Price
10.3.1 Global PE Sports Turf Sales Growth Rate (2015-2020)
10.3.2 Global PE Sports Turf Price (2015-2020)
10.4 Nylon Sports Turf Sales Growth Rate and Price
10.4.1 Global Nylon Sports Turf Sales Growth Rate (2015-2020)
10.4.2 Global Nylon Sports Turf Price (2015-2020)
10.5 Others Sales Growth Rate and Price
10.5.1 Global Others Sales Growth Rate (2015-2020)
10.5.2 Global Others Price (2015-2020)
11.1 Global Artificial TurfSales Market Share by Application (2015-2020)
11.2 Football Stadium Sales Growth Rate (2015-2020)
11.3 Hockey Stadium Sales Growth Rate (2015-2020)
11.4 Tennis & Paddle Stadium Sales Growth Rate (2015-2020)
11.5 Multisports Stadium Sales Growth Rate (2015-2020)
11.6 Rugby Stadium Sales Growth Rate (2015-2020)
11.7 Others Sales Growth Rate (2015-2020)
12.1 Global Artificial Turf Revenue, Sales and Growth Rate (2020-2027)
12.2 Artificial Turf Market Forecast by Regions (2020-2027)
12.2.1 Europe Artificial Turf Market Forecast (2020-2027)
12.2.2 APAC Artificial Turf Market Forecast (2020-2027)
12.2.3 North America Artificial Turf Market Forecast (2020-2027)
12.2.4 South America Artificial Turf Market Forecast (2020-2027)
12.2.5 Middle East & Africa Artificial Turf Market Forecast (2020-2027)
12.3 Artificial Turf Market Forecast by Type (2020-2027)
12.3.1 Global Artificial Turf Sales Forecast by Type (2020-2027)
12.3.2 Global Artificial Turf Market Share Forecast by Type (2020-2027)
12.4 Artificial Turf Market Forecast by Application (2020-2027)
12.4.1 Global Artificial Turf Sales Forecast by Application (2020-2027)
12.4.2 Global Artificial Turf Market Share Forecast by Application (2020-2027)
13 Analysis of Artificial Turf Industry Key Manufacturers
13.1 ACT Global Sports
13.1.1 Company Details
13.1.2 Product Information
13.1.3 ACT Global Sports Artificial Turf Production, Price, Cost, Gross Margin, and Revenue (2018-2020)
13.1.4 Main Business Overview
13.1.5 ACT Global Sports News
13.2 AstroTurf
13.2.1 Company Details
13.2.2 Product Information
13.2.3 AstroTurf Artificial Turf Production, Price, Cost, Gross Margin, and Revenue (2018-2020)
13.2.4 Main Business Overview
13.2.5 AstroTurf News
13.3 Co Creation Grass
13.3.1 Company Details
13.3.2 Product Information
13.3.3 Co Creation Grass Artificial Turf Production, Price, Cost, Gross Margin, and Revenue (2018-2020)
13.3.4 Main Business Overview
13.3.5 Co Creation Grass News
13.4 Domo Sports Grass
13.4.1 Company Details
13.4.2 Product Information
13.4.3 Domo Sports Grass Artificial Turf Production, Price, Cost, Gross Margin, and Revenue (2018-2020)
13.4.4 Main Business Overview
13.4.5 Domo Sports Grass News
13.5 DuPont
13.5.1 Company Details
13.5.2 Product Information
13.5.3 DuPont Artificial Turf Production, Price, Cost, Gross Margin, and Revenue (2018-2020)
13.5.4 Main Business Overview
13.5.5 DuPont News
13.6 Edel Grass B.V.
13.6.1 Company Details
13.6.2 Product Information
13.6.3 Edel Grass B.V. Artificial Turf Production, Price, Cost, Gross Margin, and Revenue (2018-2020)
13.6.4 Main Business Overview
13.6.5 Edel Grass B.V. News
13.7 FieldTurf (Tarkett)
13.7.1 Company Details
13.7.2 Product Information
13.7.3 FieldTurf (Tarkett) Artificial Turf Production, Price, Cost, Gross Margin, and Revenue (2018-2020)
13.7.4 Main Business Overview
13.7.5 FieldTurf (Tarkett) News
13.8 ForestGrass
13.8.1 Company Details
13.8.2 Product Information
13.8.3 ForestGrass Artificial Turf Production, Price, Cost, Gross Margin, and Revenue (2018-2020)
13.8.4 Main Business Overview
13.8.5 ForestGrass News
13.9 LIMONTA SPORT
13.9.1 Company Details
13.9.2 Product Information
13.9.3 LIMONTA SPORT Artificial Turf Production, Price, Cost, Gross Margin, and Revenue (2018-2020)
13.9.4 Main Business Overview
13.9.5 LIMONTA SPORT News
13.10 Mondo
13.10.1 Company Details
13.10.2 Product Information
13.10.3 Mondo Artificial Turf Production, Price, Cost, Gross Margin, and Revenue (2018-2020)
13.10.4 Main Business Overview
13.10.5 Mondo News
13.11 Nurteks
13.11.1 Company Details
13.11.2 Product Information
13.11.3 Nurteks Artificial Turf Production, Price, Cost, Gross Margin, and Revenue (2018-2020)
13.11.4 Main Business Overview
13.11.5 Nurteks News
13.12 Polytan GmbH
13.12.1 Company Details
13.12.2 Product Information
13.12.3 Polytan GmbH Artificial Turf Production, Price, Cost, Gross Margin, and Revenue (2018-2020)
13.12.4 Main Business Overview
13.12.5 Polytan GmbH News
13.13 Saltex Oy
13.13.1 Company Details
13.13.2 Product Information
13.13.3 Saltex Oy Artificial Turf Production, Price, Cost, Gross Margin, and Revenue (2018-2020)
13.13.4 Main Business Overview
13.13.5 Saltex Oy News
13.14 Shaw Sports Turf
13.14.1 Company Details
13.14.2 Product Information
13.14.3 Shaw Sports Turf Artificial Turf Production, Price, Cost, Gross Margin, and Revenue (2018-2020)
13.14.4 Main Business Overview
13.14.5 Shaw Sports Turf News
13.15 SIS Pitches
13.15.1 Company Details
13.15.2 Product Information
13.15.3 SIS Pitches Artificial Turf Production, Price, Cost, Gross Margin, and Revenue (2018-2020)
13.15.4 Main Business Overview
13.15.5 SIS Pitches News
13.16 Sporturf
13.16.1 Company Details
13.16.2 Product Information
13.16.3 Sporturf Artificial Turf Production, Price, Cost, Gross Margin, and Revenue (2018-2020)
13.16.4 Main Business Overview
13.16.5 Sporturf News
13.17 Taishan
13.17.1 Company Details
13.17.2 Product Information
13.17.3 Taishan Artificial Turf Production, Price, Cost, Gross Margin, and Revenue (2018-2020)
13.17.4 Main Business Overview
13.17.5 Taishan News
13.18 Tencate Group
13.18.1 Company Details
13.18.2 Product Information
13.18.3 Tencate Group Artificial Turf Production, Price, Cost, Gross Margin, and Revenue (2018-2020)
13.18.4 Main Business Overview
13.18.5 Tencate Group News
13.19 TigerTurf Americas
13.19.1 Company Details
13.19.2 Product Information
13.19.3 TigerTurf Americas Artificial Turf Production, Price, Cost, Gross Margin, and Revenue (2018-2020)
13.19.4 Main Business Overview
13.19.5 TigerTurf Americas News
15 Appendix


